


What is Interpolation?
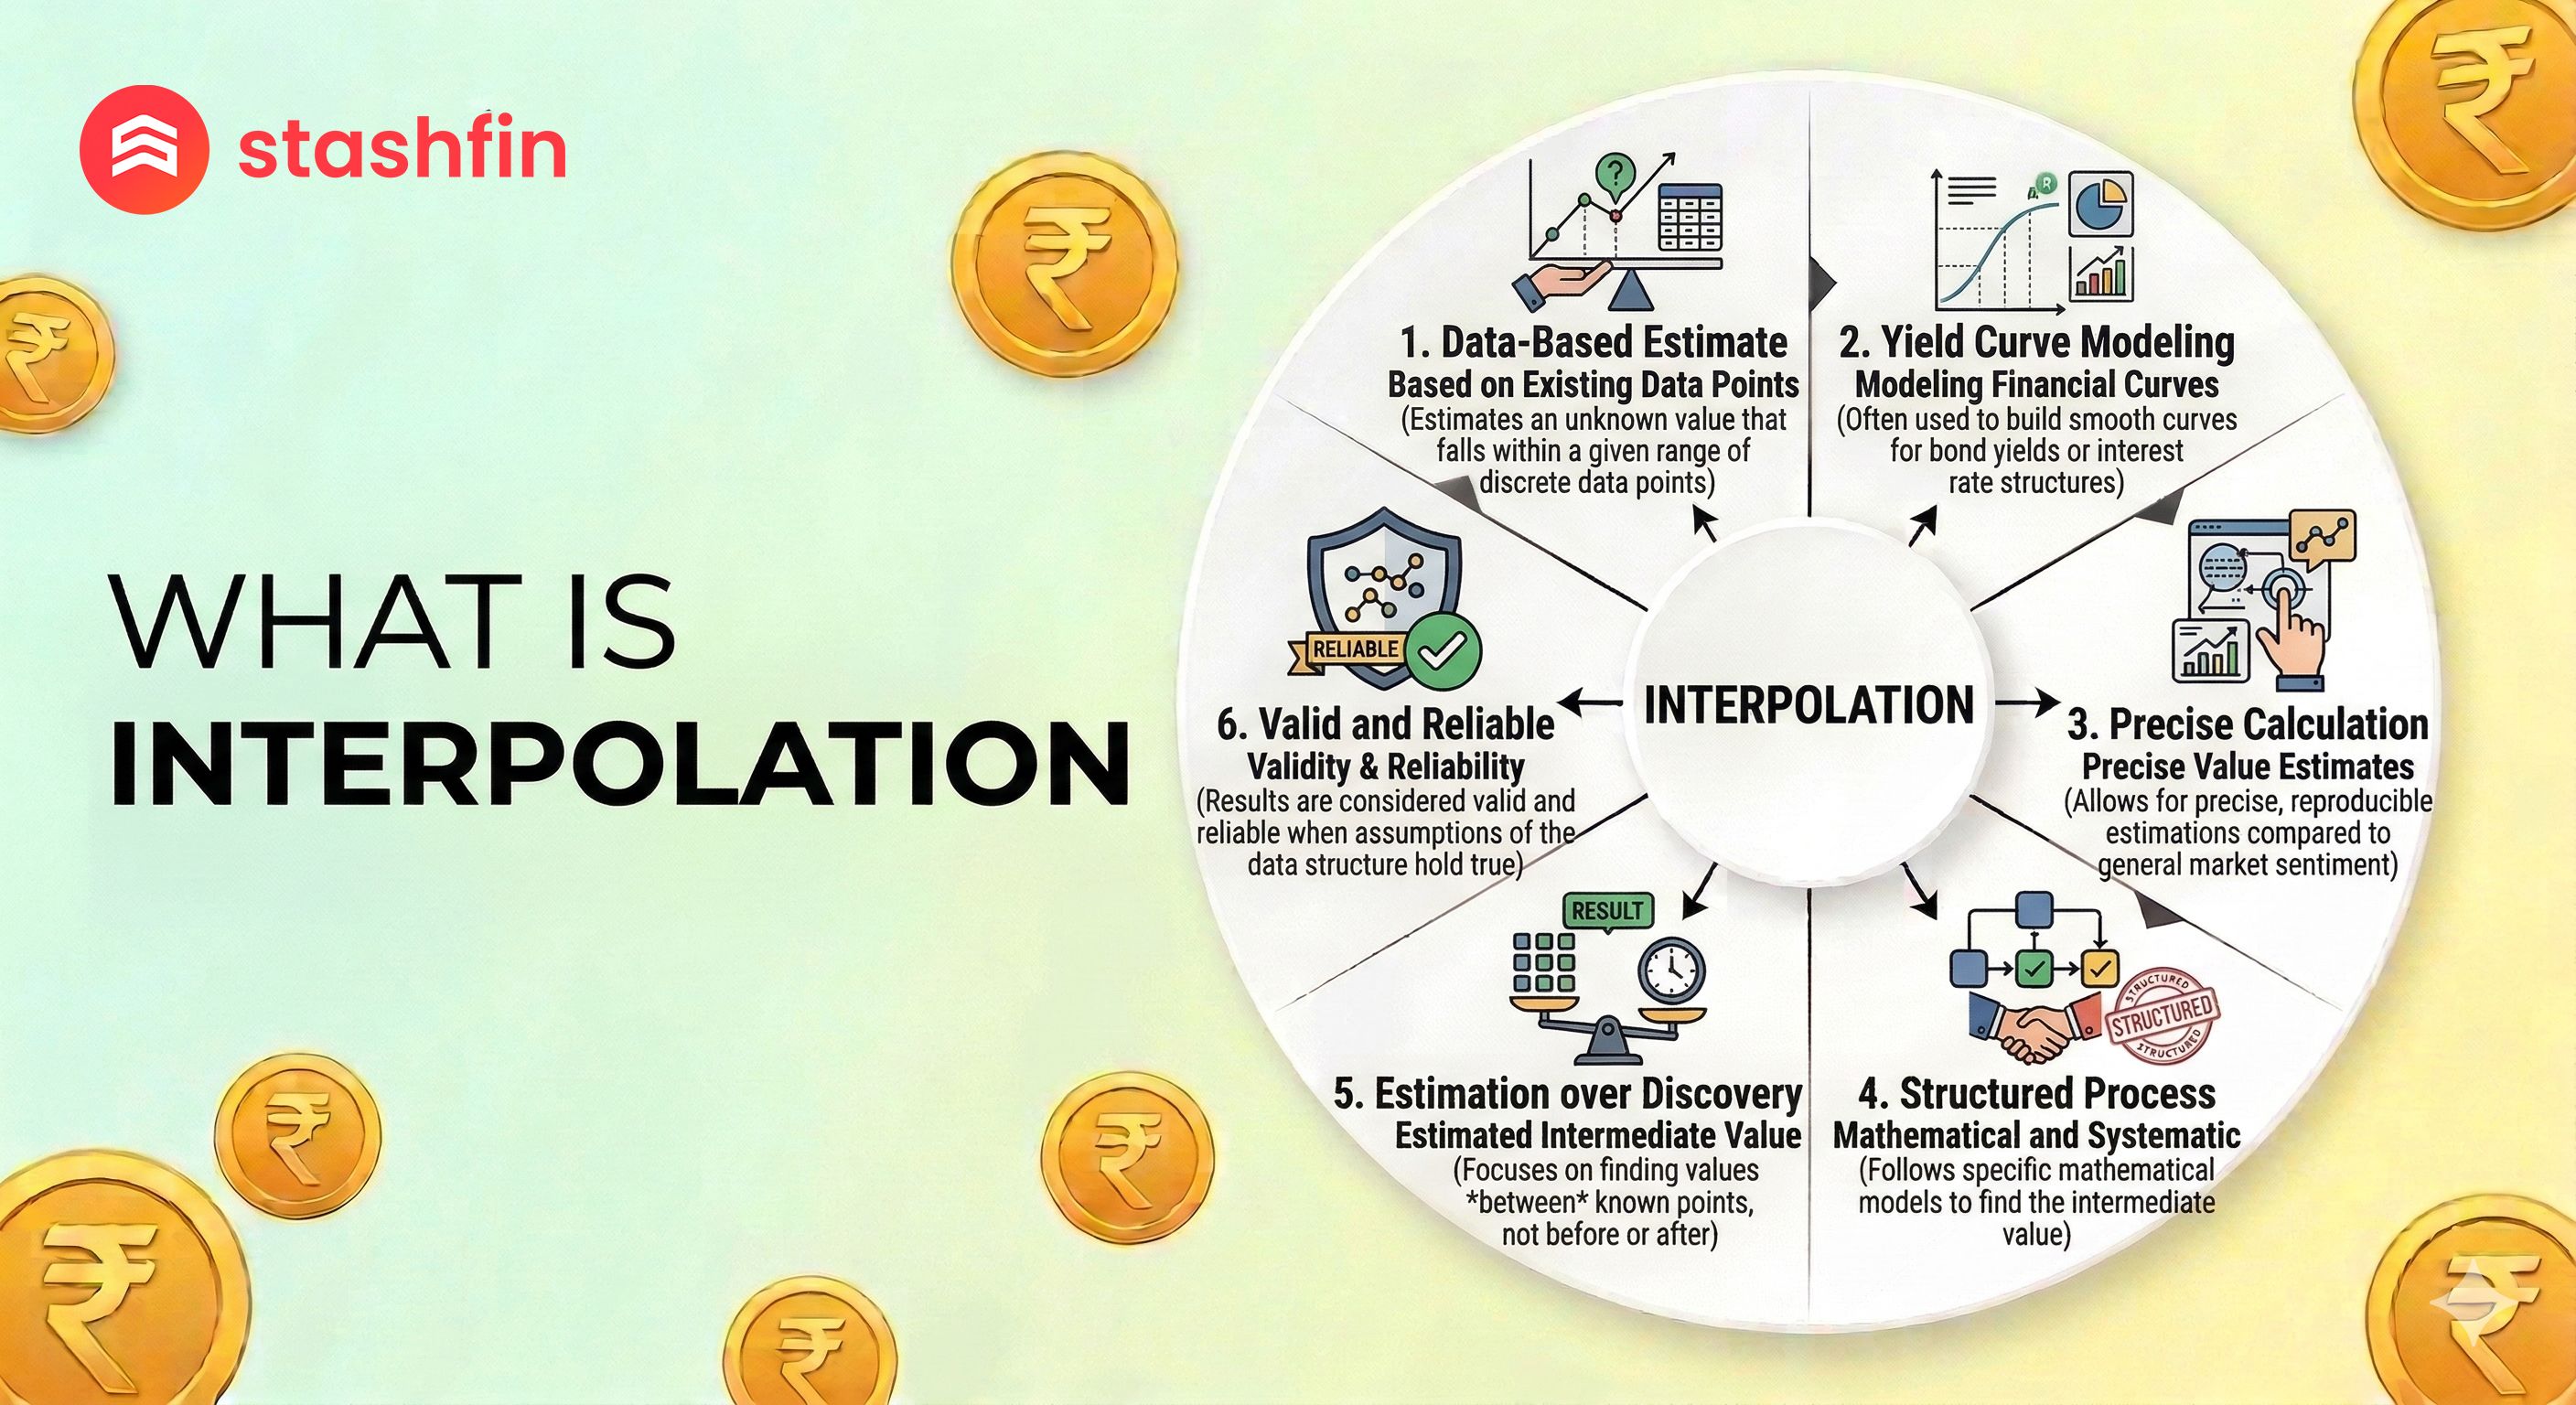
Interpolation is a mathematical and statistical technique used to estimate unknown values that fall within the range of a discrete set of known data points. Essentially, it is the art of "connecting the dots" to find a missing link.


Imagine you have two data points on a graph: the price of a stock at 10 AM and its price at 2 PM. If you need to estimate what the price was at 12 PM, you use interpolation. It assumes that the change between the two known points follows a predictable pattern, allowing you to find a reasonably accurate "middle ground."
1. How Interpolation Works: The Logic of Continuity
The core principle behind interpolation is continuity. It operates on the assumption that real-world phenomena—like interest rates, stock prices, or market trends—rarely jump erratically from one point to another without a transition.
By building a "bridge" between two known values, interpolation allows analysts and borrowers to:
- Estimate intermediate values: Finding a 7.5-year bond yield when only 5-year and 10-year data are available.
- Smooth out datasets: Creating a continuous curve from a few scattered data points.
- Complete records: Filling in missing monthly entries in a multi-year financial report.
2. Common Types of Interpolation
In 2026, while AI does much of the heavy lifting, understanding the logic behind these three common methods is essential for any savvy investor:
A. Linear Interpolation
This is the simplest form. It assumes that the change between two points is a straight line.
Example: If a 12-month interest rate is 10% and a 24-month rate is 12%, linear interpolation estimates the 18-month rate to be exactly 11%.
B. Polynomial Interpolation
This method uses a complex mathematical curve (a polynomial) to fit through several data points. It is more accurate than linear interpolation when dealing with data that bends, such as economic growth rates, but can sometimes "overshoot" if the curve is too steep.
C. Spline Interpolation
Often used in high-level financial modeling (like constructing yield curves), spline interpolation uses small "pieces" of low-degree curves to connect points smoothly. It avoids the erratic swings of high-order polynomials, making it a favorite for risk analysts.
3. Interpolation vs. Extrapolation: Don't Confuse the Two
While they sound similar, they serve very different purposes. Knowing the difference is key to avoiding financial "hallucinations."
| Feature | Interpolation | Extrapolation |
|---|---|---|
| Location | Inside the known range. | Outside (beyond) the known range. |
| Reliability | High (Relies on nearby data). | Lower (Speculative). |
| Purpose | To find a missing link. | To forecast the future or past. |
| Risk | Minimal, assuming a smooth trend. | High, as trends can change suddenly. |
4. Why Interpolation Matters in Personal Finance
You might not be solving calculus equations every day, but interpolation is working behind the scenes in many financial products you use:
- Loan Pricing: Lenders often have fixed rates for 1-year and 2-year tenures. If you ask for an 18-month loan, the system uses interpolation to find a fair, customized interest rate for that specific duration.
- Bond Yields: In fixed income, "tenors" (durations) don't always match. Investors use interpolation to estimate the yield of a bond with an "odd" maturity date based on the existing yield curve.
- Budgeting and Forecasting: If you missed a few entries while tracking expenses, interpolation helps estimate your average spending to keep your 2026 financial plan on track.
- Valuing Derivatives: For advanced wealth products, interpolation is vital for pricing options and swaps where market data might be sparse for certain dates.
Conclusion
Interpolation is the "quiet workhorse" of financial data. It brings order to scattered points and converts gaps into usable information. By staying within the boundaries of known data, it provides a disciplined, reliable way to estimate values without resorting to blind guessing.
At Stashfin, we use data-driven insights to ensure our credit products are priced fairly and transparently, using the same mathematical rigor that institutions use to manage global markets.