


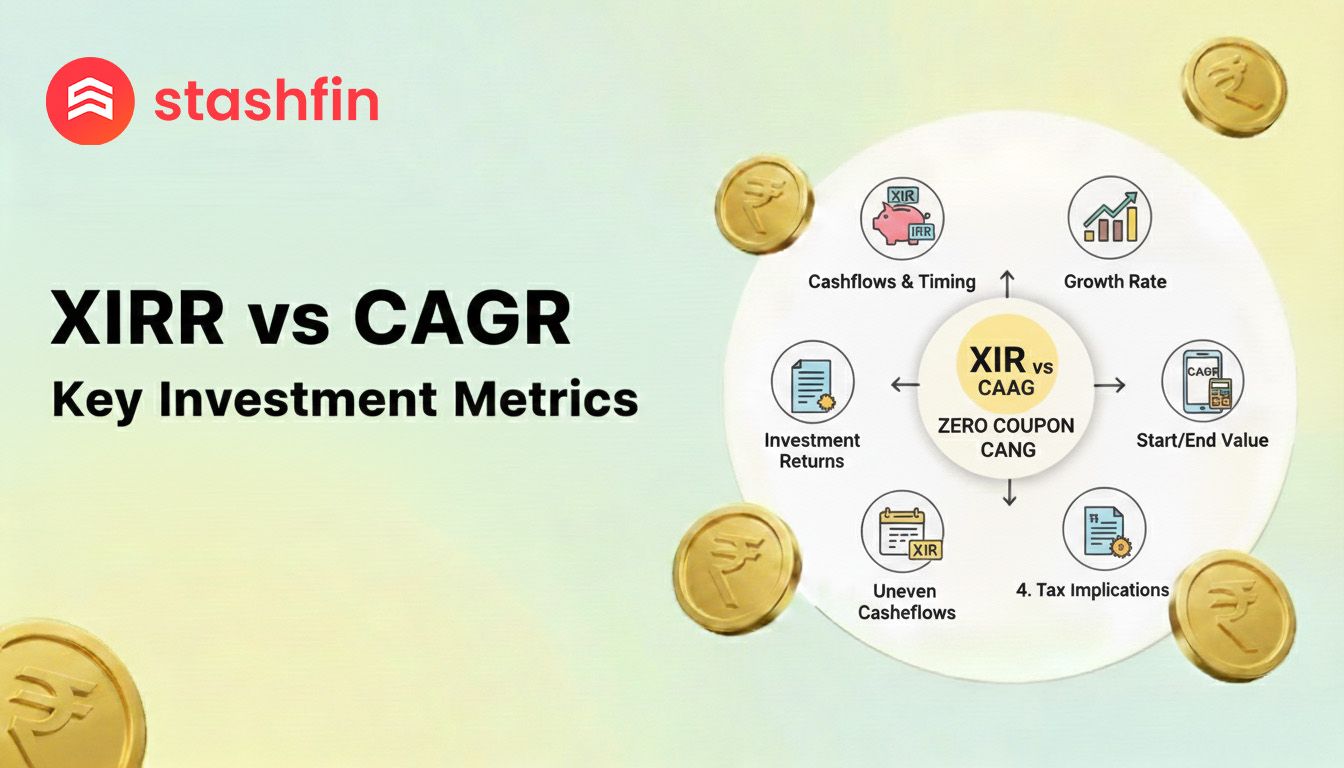
XIRR vs. CAGR: The Truth About Your Investment Returns
You open your investment app and stare at the dashboard. You see two different acronyms practically shouting at you: CAGR and XIRR. They both claim to tell you how much money you made, but the numbers are often entirely different.


Which one is lying to you? The short answer is neither. They are simply answering two very different questions about your money.
The Problem with Measuring Money
If you plant an apple seed today and harvest ten apples five years from now, measuring success is easy. You look at the starting point, the ending point, and the time that passed.
But real-world investing is messy. You might:
- Invest ₹10,000 in January.
- Pull out ₹3,000 in June for an emergency.
- Dump in ₹15,000 in December when your bonus hits.
Because your money is constantly moving in and out, the financial world split return metrics into two distinct camps.
CAGR: The Smooth Operator (Best for Lump Sums)
CAGR stands for Compound Annual Growth Rate. It is the straight-line, no-nonsense way to look at a lump-sum investment.
Imagine you buy a plot of land for ₹50 lakh and don't touch it for ten years. A decade later, you sell it for ₹1 crore. CAGR calculates the exact, steady percentage your money had to grow every single year to reach that final number.
Key Characteristics:
- Ignores Volatility: It doesn't care if the property value crashed in year three or skyrocketed in year nine.
- Simplification: It gives you the smoothed-out, average annual "speed" of your money.
- Best Use: If you invest a lump sum and leave it alone, CAGR is your best friend.
XIRR: The Reality Check (Best for SIPs)
XIRR stands for Extended Internal Rate of Return. Unlike CAGR, XIRR loves the messy reality of your bank account. It is specifically designed to handle irregular cash flows, like Systematic Investment Plans (SIPs) or random mutual fund top-ups.
If you invest ₹5,000 every month for three years, your first installment has been working for 36 months, while your final installment has only been invested for a single month. XIRR treats every single payment as a separate mini-investment with its own ticking clock.
The Ultimate Showdown: When to Use Which?
| Scenario | Use This Metric | Why? |
|---|---|---|
| Fixed Deposit / One-time Mutual Fund Buy | CAGR | There is only one entry point and one exit point. |
| Monthly SIP / Recurring Deposit | XIRR | Each "installment" has a different duration in the market. |
| Stock Portfolio with Dividends/Top-ups | XIRR | It accounts for the exact dates money moved in or out. |
| Buying a House (No Rent) | CAGR | It measures the growth of the asset value over time. |
How to Calculate XIRR Without Losing Your Mind
You don't need a math degree; you just need Microsoft Excel or Google Sheets.
- Column A: List the exact dates of your transactions.
- Column B: List the amounts.
- Investments = Negative numbers (money leaving your pocket).
- Current Portfolio Value = Positive number (money you could withdraw today).
- The Formula: At the bottom, type
=XIRR(B1:B10, A1:A10)and hit enter.
The software will instantly do millions of trial-and-error calculations to spit out your true, personal rate of return.