


Understanding the Standard Deviation of a Mutual Fund
When you invest in a mutual fund, you are exposed to the possibility that your returns will move up and down over time. Some funds experience gentle, gradual movement, while others swing sharply in either direction. Standard deviation is the statistical tool that captures this behaviour. It measures how widely a fund's periodic returns have spread around their historical average, giving investors a clearer picture of the range of outcomes they might face.


What Standard Deviation Actually Means
At its core, standard deviation quantifies consistency. A fund that delivers returns close to its average in every period will have a low standard deviation. A fund whose returns vary widely — soaring in some periods and falling steeply in others — will carry a high standard deviation. In plain terms, a higher standard deviation signals greater unpredictability, while a lower standard deviation suggests the fund's performance has been more stable over time.
It is important to understand that standard deviation is a backward-looking measure. It is calculated using historical return data and describes what has already happened, not what will happen in the future. Investors use it as a reference point to gauge the nature of the ride a fund has historically offered.
Why Volatility Matters to Investors
Volatility is not inherently bad, but it is important to know about it before you invest. If you are an investor with a short time horizon or a low tolerance for seeing your portfolio value fluctuate, a fund with high standard deviation may cause anxiety and lead to impulsive decisions. On the other hand, if you have a long investment horizon and the emotional resilience to stay invested through market swings, a higher-volatility fund may still align with your goals.
Understanding the volatility measure in a mutual fund helps you set realistic expectations. It prevents the common mistake of being surprised when a fund you thought was stable suddenly delivers a very different return than you anticipated. Knowledge of standard deviation essentially prepares you for the emotional journey of investing.
How Standard Deviation Fits Into the Broader Risk Picture
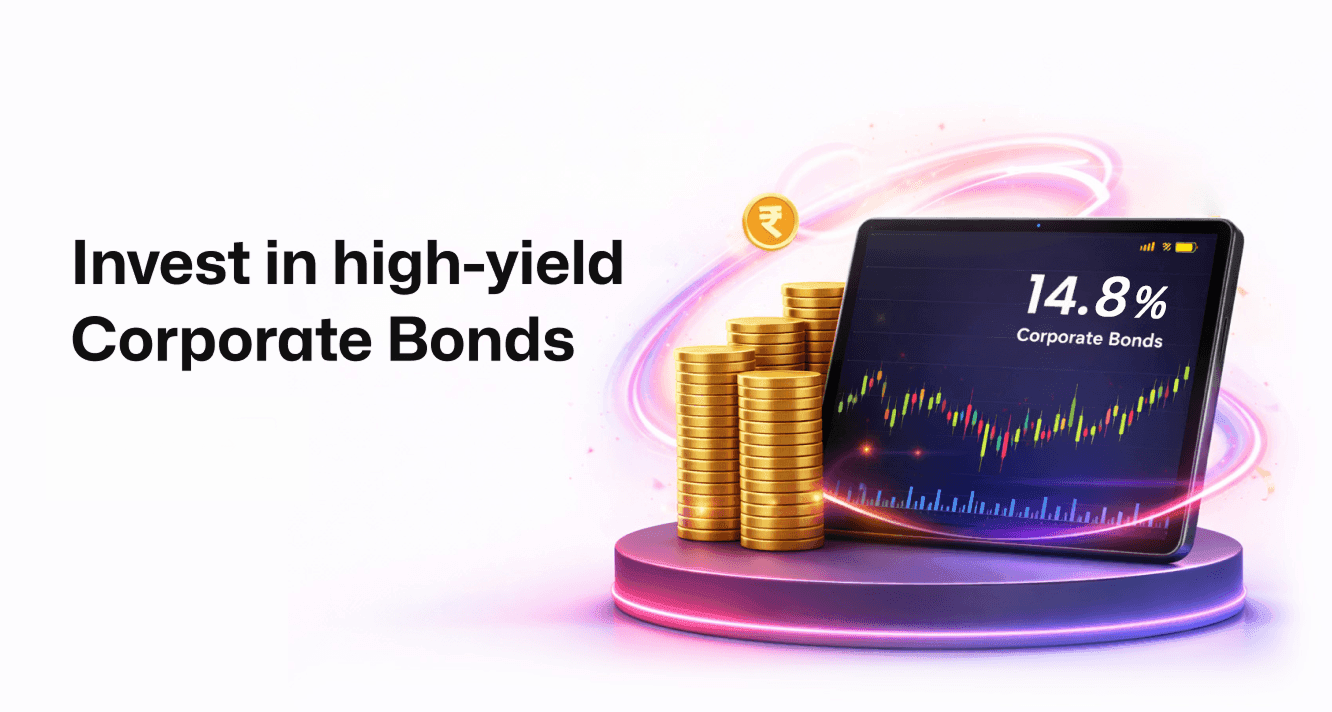
Standard deviation is one piece of a larger risk-assessment puzzle. When reviewing a fund, investors and advisors often look at it alongside other risk metrics such as beta, Sharpe ratio, and alpha. Each of these indicators illuminates a different dimension of risk and return. Standard deviation specifically addresses total volatility — it does not distinguish between upside and downside movements. A fund could have a high standard deviation because it has produced spectacularly good returns in some periods, not just because it has fallen sharply.
This is why standard deviation should never be read in isolation. Pairing it with a measure like the Sharpe ratio, which accounts for the return earned per unit of risk taken, gives a more balanced view of whether the volatility a fund has exhibited has been rewarded adequately.
Comparing Funds Using Standard Deviation
One of the most practical uses of standard deviation is comparison. When two funds belong to the same category — for example, both are large-cap equity funds — comparing their standard deviations gives you a sense of which one has historically been the more stable performer. A fund in the same category with a meaningfully lower standard deviation has delivered its returns with less historical fluctuation.
However, comparisons should always be made within the same fund category and over the same time period. Comparing the standard deviation of a liquid fund with that of a mid-cap equity fund, for instance, would be misleading because the nature and purpose of these funds are entirely different. Category-to-category comparisons strip away context and can lead to poor investment decisions.
Standard Deviation and Your Risk Profile
Mutual fund risk profiling — the process of understanding how much risk you can bear — is a step that SEBI and AMFI encourage all investors to undertake before selecting a fund. Standard deviation is a metric that complements this process. Once you have an understanding of your own risk appetite, you can use the standard deviation of a fund to check whether its historical volatility is broadly in line with the level of fluctuation you are comfortable experiencing.
For conservative investors, funds that have historically shown lower standard deviations within their category may feel more comfortable. For aggressive investors seeking higher long-term growth potential, a higher standard deviation may be acceptable, provided the investor understands and accepts the associated uncertainty.
Where to Find This Information
Standard deviation figures for mutual funds are generally available in fund factsheets, which are published monthly by asset management companies. You can also find this information on financial portals and through platforms like Stashfin, which aim to make such data accessible so that investors can make better-informed choices. Reading the scheme information document and the key information memorandum of any fund before investing is a practice strongly recommended by SEBI and AMFI.
Making Standard Deviation Work for You
The real value of understanding standard deviation lies in using it as a filter, not a final verdict. It helps you shortlist funds that match your risk comfort and then dive deeper into other qualitative and quantitative aspects before making a decision. Treat it as one reliable signal in a broader due-diligence process rather than the sole determinant of a fund's suitability.
Investing in mutual funds is a long-term commitment for most people. Volatility, as measured by standard deviation, is a natural companion on that journey. Knowing how to read it helps you stay grounded during turbulent market phases and make decisions based on informed reasoning rather than short-term emotion. Platforms like Stashfin are designed to help investors explore mutual fund options with access to the kind of risk information that makes this possible.
Mutual fund investments are subject to market risks. Past performance is not an indicator of future returns. Please read all scheme-related documents carefully before investing.